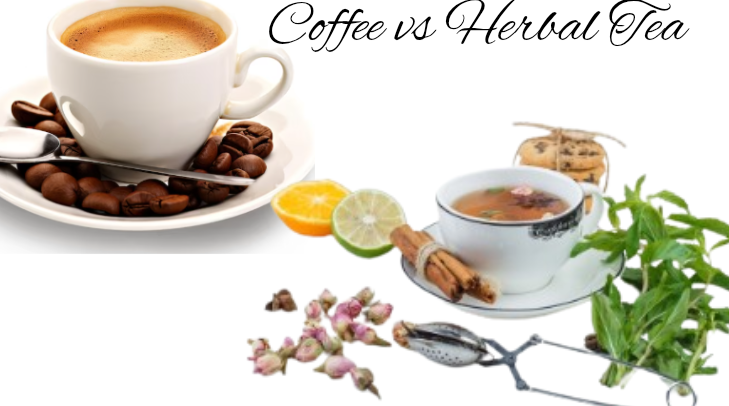
Coffee vs Tea: 20 Soulful Herbal Tea Recipes-Heal Naturally,Feel Lighter & Healthier Every Day!
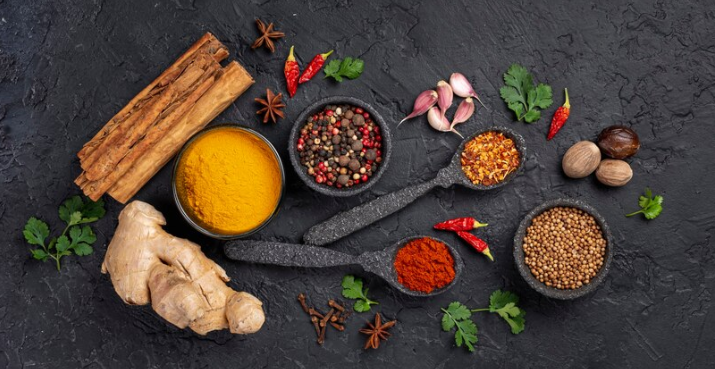
Herbal Tea
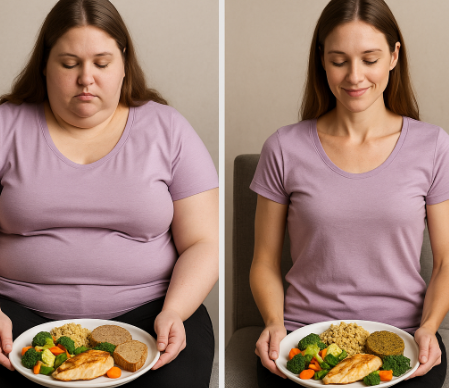
Healthy Weightloss with Millet & Lifestyle
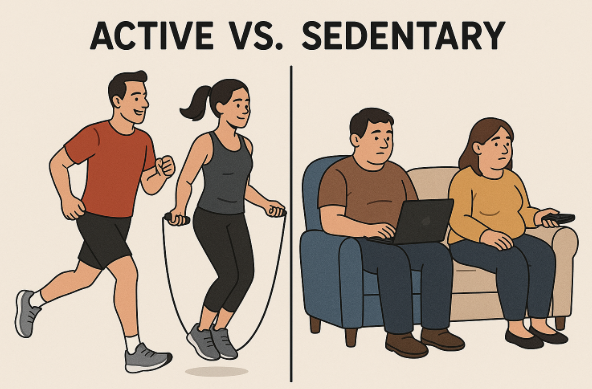
Active vs Sedentary Lifestyle

Yoga Day – Yoga Asanas from Office Chair
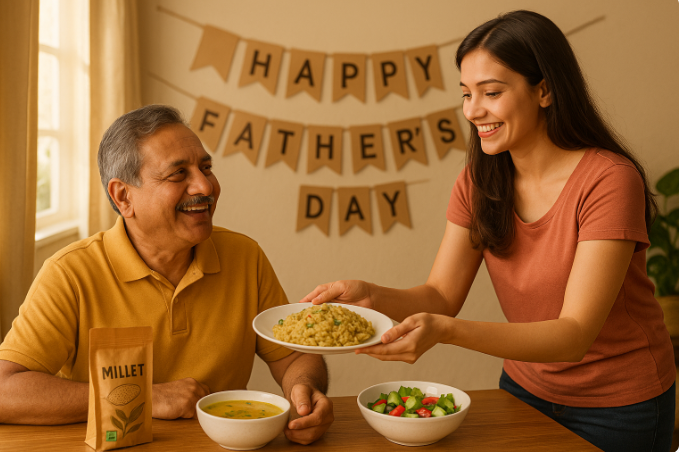
Happy Father’s Day: Strong Fathers, Healthier Futures: A Heartfelt Guide to Men’s Health, Nutrition & Disease Prevention
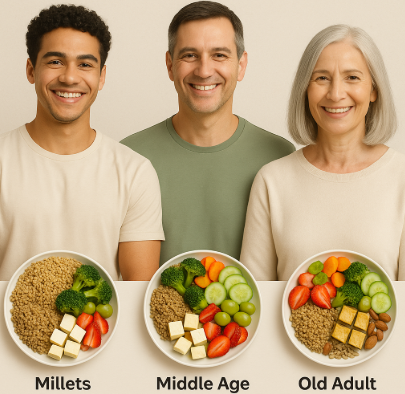
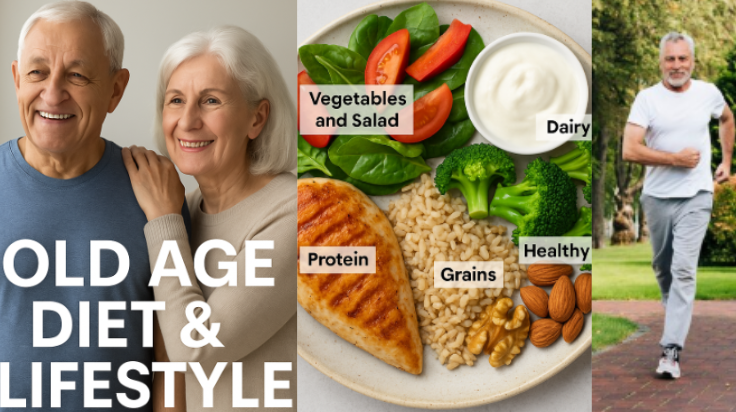
Top 3 Balanced Diet Plans for Adults (18–60): Unlock Ageless Health & Energy Today
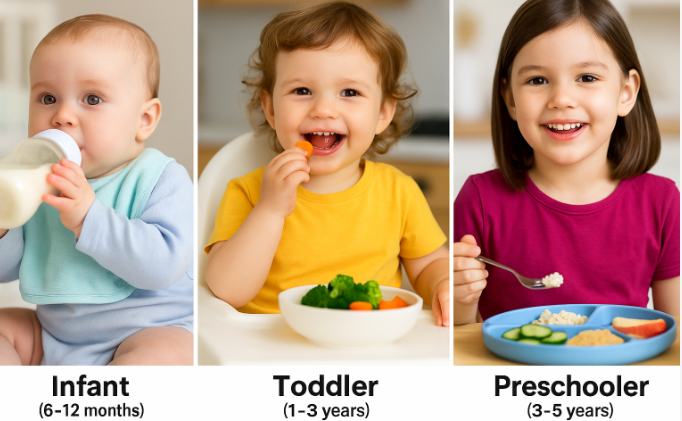
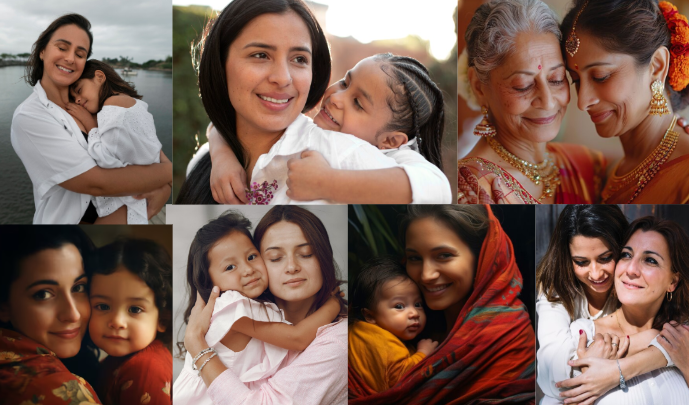
Child Food: Infant vs Toddler vs Pre-School