Top 10 Office Culture Red Flags 🚩That Signals Corporate Governance Failure & Exit
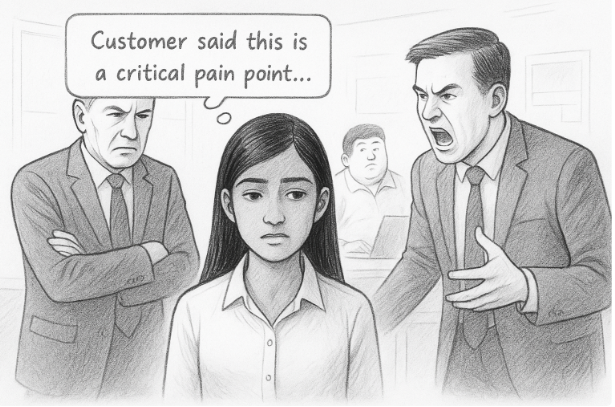
Priya’s Story – Office Culture Red Flags
Priya’s Story – Office Culture Red Flags

🕵️♂️ Case Example: Unreported RPT at a Global Subsidiary

Catching Fraud with SAP FCM – Financial Compliance Management

Fraud Detection with SAP
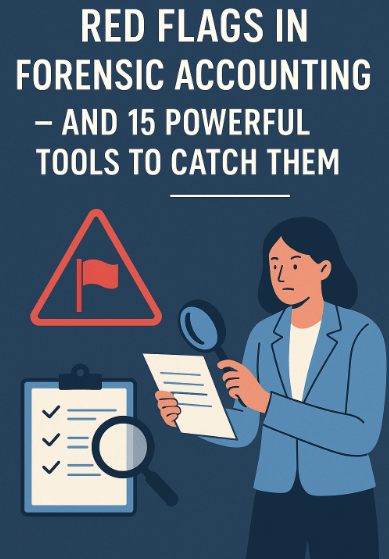
15 Powerful Tools to Catch Red Flags in Forensic Accounting

How long tenure & complacent employees kill business
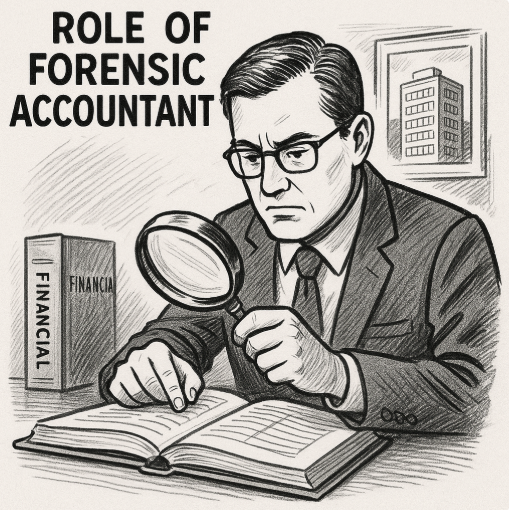
Role of Forensic Accounting

10 Red Flags in Corporate Governance

Oppression & Mismanagement in a Company
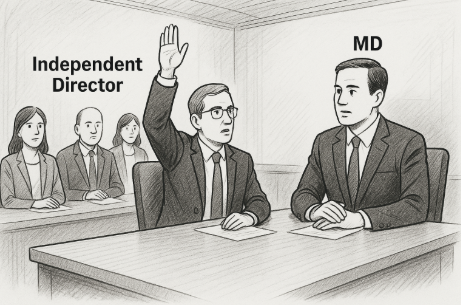
Role of Independent Director in a company

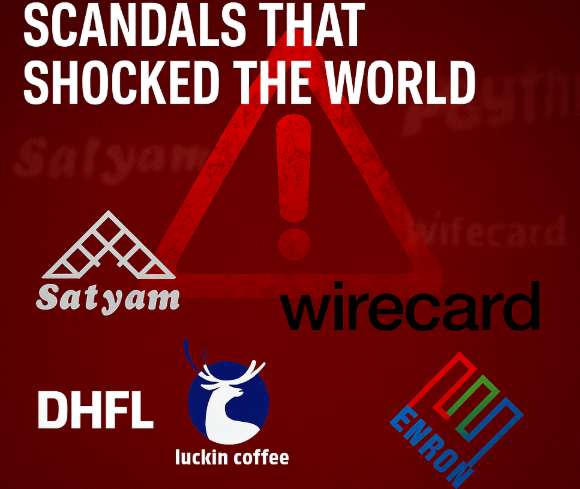
Related Party Transactions: Satyam & DHFL Scam Explained