Decode Life. Discover Purpose. Drive Change.
At grey2green.in/, we’re your digital companion for awareness, motivation, and purposeful action—unpacking real stories, global issues, and the paths that lead to a better you and a better world.
🌐 Search What Matters to You


✨ Explore Our Core Themes
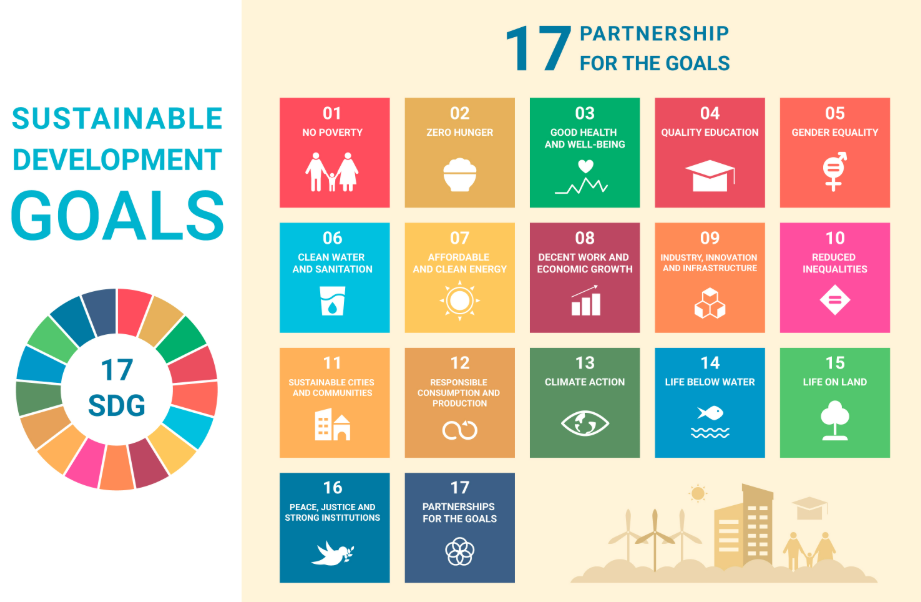
🌍 United Nations Sustainable Development Goals (UN SDGs)
Deep dives into the 17 global goals shaping a sustainable future.
What can you do to help achieve them? We simplify it for action.
👩🦰 Green Society
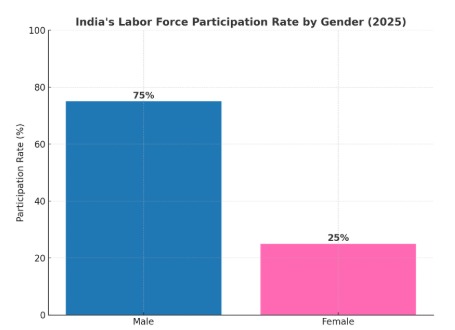
Women Empowerment
Stories of strength, breakthroughs, and leadership.
From boardrooms to grassroots—how women are reshaping the world.


📈 Success Stories & Biographies
From unknown to unforgettable.
Motivating journeys of people who turned setbacks into stepping stones.
🏢 Green Work
Corporate Ethics & Governance
How businesses lead with purpose.
We spotlight value-driven leadership, ESG practices, and ethical frameworks.


🏢 Green Living
Green Living is about making mindful choices—prioritizing health, reducing stress, and living in harmony with the environment. Small daily actions lead to a more balanced life and a sustainable future.